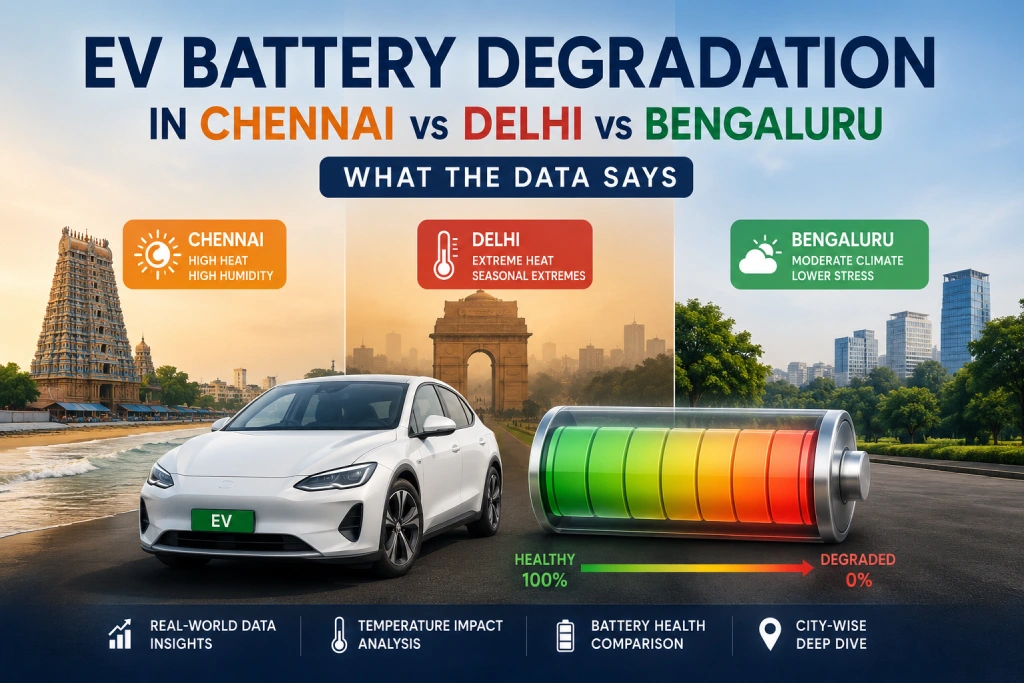
EV Battery Degradation in Chennai vs Delhi vs Bengaluru: What the Data Says
Quick Answer
Does an EV battery degrade faster in Chennai, Delhi or Bengaluru?
Climate can affect EV battery degradation, but there is no reliable public dataset that supports saying an identical EV will lose a specific percentage of battery capacity per year in Chennai, Delhi or Bengaluru. Geotab's latest real-world analysis found an average EV battery degradation rate of 2.3% per year across more than 22,700 EVs and 21 makes/models, with vehicles operating in hot climates degrading about 0.4 percentage points faster per year than those in mild climates. (Geotab)
Charging behaviour is also important. In Geotab's latest analysis, vehicles with high-frequency DC fast charging where more than 40% of DC fast-charging sessions exceeded 100 kW averaged 3.0% annual degradation, compared with 1.5% for vehicles in the low-frequency DC fast-charging group. (Geotab)
Chennai vs Delhi vs Bengaluru climate
| City | Mean annual temperature | Average daily high | Days ≥30°C/year |
|---|---|---|---|
| Chennai | 27.9°C | 30.9°C | 222 |
| Delhi | 24.7°C | 31.0°C | 218 |
| Bengaluru | 23.5°C | 28.7°C | 110 |
These are climate measurements, not battery-degradation measurements. The figures are ERA5 reanalysis-derived climate normals for 1940–2025. (Climate Memory)
Bottom line: Chennai has the highest mean annual temperature of the three cities in this dataset, Bengaluru has the lowest, and Delhi combines substantial heat exposure with much greater seasonal variation. However, climate alone cannot tell you how quickly a particular EV battery will degrade. Battery chemistry, thermal management, charging power, state of charge and vehicle usage also matter. (Climate Memory)
What Is EV Battery Degradation?
EV battery degradation is the gradual reduction in a battery's ability to store energy over time. Battery condition is commonly expressed using State of Health (SOH), which compares the battery's current usable capacity with its capacity when new. Geotab gives the example of a 60 kWh battery at 90% SOH effectively having about 54 kWh of usable capacity. (Geotab)
Battery degradation is a normal ageing process. Geotab describes degradation as a permanent reduction in the amount of energy a battery can store or the power it can deliver, with energy-storage loss being the more relevant degradation measure for EV range. (Geotab)
Battery degradation is not the same as temporary range loss
An EV's displayed range can change without the battery having permanently lost the same percentage of capacity.
Temperature, operating conditions and battery-management-system behaviour can influence observed battery performance. Consequently, a lower displayed range on a particular day should not automatically be interpreted as permanent battery degradation. Geotab's battery-health methodology tracks longer-term battery-capacity changes rather than treating every short-term range variation as degradation. (Geotab)
How Much Do EV Batteries Degrade Per Year?
There is no single degradation rate that applies to every EV. However, Geotab's latest real-world analysis reports an average annual degradation rate of 2.3% across more than 22,700 EVs covering 21 makes and models. (Geotab)
That number should be treated as a real-world dataset average, not a guaranteed degradation rate for your particular vehicle.
Geotab's earlier analysis produced a different average. Its 2024 study analysed approximately 5,000 EVs representing about 1.5 million days of telematics data and reported average degradation of 1.8% per year. (Geotab)
The difference between the studies is important because it demonstrates why publishing a universal “EV batteries lose exactly X% every year” figure can be misleading.
The newer dataset contains newer EV generations and different usage patterns, including greater reliance on high-power charging. Geotab specifically identifies charging behaviour as an important contributor to the newer results. (Geotab)
What does 2.3% per year mean?
It means that the average degradation rate observed in the Geotab dataset was 2.3% of battery capacity per year.
It does not mean:
- every EV loses 2.3% annually;
- every EV retains exactly 77% after 10 years;
- an EV in Chennai will lose 2.3% plus a fixed climate penalty;
- an EV with 90% SOH today will necessarily follow a perfectly linear decline.
Real-world degradation varies between vehicles and operating conditions. Geotab's data shows substantial variation associated with vehicle model and operating conditions. (Geotab)
Chennai vs Delhi vs Bengaluru: What Does the Climate Data Show?
The first step in comparing cities is to compare climate exposure, not battery degradation.
The following figures come from ERA5 reanalysis data covering 1940–2025.
Chennai
Chennai's mean daily temperature over the 1940–2025 period is 27.9°C, while the average daily high is 30.9°C. The dataset records 222 days per year at or above 30°C. (Climate Memory)
Chennai therefore has the highest mean annual temperature among the three cities in this comparison. (Climate Memory)
Delhi
Delhi's mean daily temperature is 24.7°C, with an average daily high of 31.0°C and approximately 218 days per year at or above 30°C in the same climate-normal dataset. (Climate Memory)
Delhi differs from Chennai because its seasonal temperature variation is much larger. The ERA5-derived dataset reports a seasonal range of 20.2°C for Delhi compared with 6.2°C for Chennai. (Climate Memory)
Bengaluru
Bengaluru has a mean daily temperature of 23.5°C and an average daily high of 28.7°C. The dataset records 110 days per year at or above 30°C. (Climate Memory)
Bengaluru therefore has the lowest mean annual temperature and substantially fewer ≥30°C days than Chennai or Delhi in this dataset. (Climate Memory)
What the comparison actually tells us
The climate data supports the following ranking for mean annual temperature:
Chennai → Delhi → Bengaluru
It also shows that Chennai and Delhi have considerably more ≥30°C days than Bengaluru. (Climate Memory)
However, this is not a battery-degradation ranking.
A climate dataset tells us about environmental exposure. It does not tell us that an EV battery in Chennai will degrade by a particular percentage faster than an identical battery in Delhi.
Does Hot Weather Actually Accelerate EV Battery Degradation?
Yes. Real-world EV data supports an association between hotter operating climates and faster battery degradation. Geotab's latest analysis grouped vehicles according to the proportion of days above 25°C and found that vehicles in the hot-climate group degraded about 0.4 percentage points faster per year than vehicles in the mild-climate group. (Geotab)
Geotab explains that higher temperatures increase chemical activity and stress inside battery cells. Modern EV battery-management systems can regulate battery temperature, but climate remains an observable factor in the real-world data. (Geotab)
The important point is that Geotab's 0.4 percentage-point result is a comparison between its defined hot and mild climate groups. It is not a Chennai-specific multiplier.
Therefore, it would be incorrect to take Chennai's 27.9°C mean annual temperature and automatically calculate a city-specific degradation percentage from the 0.4 figure.
Why City Alone Cannot Predict Battery Degradation
Two EVs parked in the same city can experience different battery ageing.
Several variables can change the degradation profile.
Battery chemistry
Different EVs use different lithium-ion battery chemistries, and battery chemistry can influence how cells respond to stress. Geotab identifies battery chemistry as one possible contributor to differences between vehicle models. (Geotab)
Therefore, “EV battery degradation in Chennai” is incomplete without considering the vehicle and battery technology.
Thermal management
Battery thermal management can influence battery degradation. Geotab's earlier analysis identified differences between vehicle models and associated battery thermal-management systems as potential contributors to differing degradation rates. (Geotab)
A climate comparison therefore cannot be separated completely from the question:
How effectively does the particular EV control battery temperature?
Charging power
Charging power is particularly important in the latest Geotab dataset.
Geotab found that high-frequency users whose DC fast-charging sessions frequently exceeded 100 kW had an average degradation rate of 3.0% per year, while its low-frequency DC fast-charging group averaged 1.5% per year. (Geotab)
The charging result is one reason a city-only calculator is inadequate.
State of charge
Geotab reports that degradation accelerated when vehicles spent more than 80% of their total time at or near full or nearly empty charge levels. (Geotab)
That does not mean an EV owner must never charge to 100% or never allow the battery to become very low.
The finding concerns the proportion of time spent near those extreme states of charge, not an isolated charging event. (Geotab)
Vehicle usage
Geotab also found a measurable relationship between higher daily use and degradation, although the company describes the effect as relatively modest compared with the effect associated with charging power. (Geotab)
This is why annual kilometres should be included in a battery-degradation estimate rather than treating every EV owner as having the same usage profile.
Does Fast Charging Matter More Than Climate?
In Geotab's latest dataset, charging power had a larger overall effect on degradation than the independent climate effect measured by the study. Vehicles in the high-frequency/high-power DC fast-charging group averaged 3.0% annual degradation, compared with 1.5% for the low-frequency group, while the hot-climate penalty was approximately 0.4 percentage points per year. (Geotab)
Geotab classified its DC fast-charging groups using charging frequency and the proportion of sessions exceeding 100 kW. The high-frequency group used DC fast charging for more than 12% of charging sessions; within that group, the high-power category had more than 40% of DC fast-charging sessions above 100 kW. (Geotab)
The comparison is useful because it changes how an EV owner should think about battery longevity.
Instead of asking only:
“Is Chennai too hot for an EV?”
a better question is:
“What combination of climate, vehicle thermal management, charging power, charging frequency and usage applies to my EV?”
That is a much more defensible battery-health assessment.
Does State of Charge Affect EV Battery Ageing?
State of charge, or SOC, describes how much charge is currently stored in the battery relative to the usable charging range.
Geotab's latest analysis found that degradation accelerated when vehicles spent more than 80% of their total time at or near full or nearly empty states of charge. (Geotab)
The finding does not support simplistic claims such as:
“Charging to 100% once will damage your battery.”
Nor does it support claiming that maintaining an exact 20–80% range will halve degradation.
The evidence supports a more precise statement: prolonged exposure to very high or very low SOC conditions can contribute to faster degradation, while occasional use of the full available range is not equivalent to permanently keeping the battery near an extreme SOC. Geotab specifically notes that most EV use does not require drivers to worry about avoiding full or empty states on every occasion. (Geotab)
What Chennai-Specific Battery Research Tells Us
India-specific research provides useful context, but it must be interpreted carefully.
A 2022 Journal of Energy Storage study examined 1.25 kWh lithium-ion battery packs used in e-rickshaws operating in Chennai. The packs had no forced cooling, and the field study involved real-world operation. The study reported 24-hour average temperature ranges of approximately 25–48°C during summer and 18–32°C during winter for the Chennai conditions studied. (ScienceDirect)
The study used field data from battery packs installed in three-wheelers and developed a first-order degradation model using laboratory cell-ageing data. (ScienceDirect)
The research is valuable because it demonstrates how battery ageing can be studied under actual Chennai operating conditions.
However, the study should not be used as the degradation rate for a modern passenger electric car.
The battery packs were 1.25 kWh, were used in e-rickshaws, and had no forced cooling. The researchers also studied a specific NMC + LMO cell configuration. (ScienceDirect)
A modern passenger EV can have a substantially different battery size, chemistry, thermal-management system, battery-management system and charging architecture.
Therefore:
Chennai field research demonstrates that Indian heat exposure matters, but it does not establish a universal Chennai passenger-EV degradation percentage.
How to Estimate EV Battery Degradation by City
A useful EV battery degradation calculator should treat city as one input among several, rather than assigning each city an arbitrary degradation multiplier.
Recommended calculator inputs
Required
- City
- EV model
- Battery capacity
- Vehicle age
- Annual kilometres
- Charging type
- DC fast-charging frequency
- Typical charging range
Optional
- Battery chemistry
- Battery thermal-management type
- Current displayed range
- Known battery SOH
These variables allow the calculator to distinguish between climate exposure and the other operating factors supported by real-world battery-health research.
How EVCalculator.in Should Use City Data
The city input should provide a climate context.
For example, the current ERA5-derived climate normals show:
- Chennai: 27.9°C mean daily temperature and 222 ≥30°C days/year. (Climate Memory)
- Delhi: 24.7°C mean daily temperature and 218 ≥30°C days/year. (Climate Memory)
- Bengaluru: 23.5°C mean daily temperature and 110 ≥30°C days/year. (Climate Memory)
Those numbers can help establish relative climate exposure.
They should not be transformed directly into:
Chennai = 4.0% degradation
Delhi = 3.5% degradation
Bengaluru = 2.5% degradation
There is no cited dataset supporting such a calculation.
The calculator should instead combine climate exposure with evidence-based vehicle and usage variables.
What Should an EV Battery Degradation Calculator Result Say?
The result should be labelled:
Estimated battery health
rather than:
Actual battery health
A calculator can estimate battery condition from assumptions and available inputs. It cannot automatically perform a manufacturer-level battery diagnostic merely because a user enters a city, model and mileage.
Geotab's own battery-health methodology uses vehicle data to track battery capacity and SOH over time, including measurements involving energy input, energy output and changes in SOC. (Geotab)
Therefore, the calculator disclaimer should say:
This result is an estimate, not a battery diagnostic. Climate data indicates relative thermal exposure, while actual battery degradation depends on vehicle model, battery chemistry, thermal management, charging power, state of charge, mileage and operating conditions.
Frequently Asked Questions
Does Chennai heat degrade EV batteries faster?
Hot climates are associated with faster EV battery degradation in Geotab's real-world analysis. Geotab found vehicles operating in its hot-climate group degraded about 0.4 percentage points faster per year than vehicles in the mild-climate group. However, the result does not establish a specific degradation percentage for Chennai. (Geotab)
Does Delhi's summer reduce EV battery life?
High-temperature exposure can contribute to faster battery degradation. Delhi's cited ERA5 climate normals show a mean daily temperature of 24.7°C, an average daily high of 31.0°C and 218 days per year at or above 30°C. Those are climate measurements, not a measured Delhi-specific battery-degradation rate. (Climate Memory)
Is Bengaluru better for EV battery health?
Bengaluru has lower average temperature exposure than Chennai and Delhi in the cited climate dataset, with a 23.5°C mean daily temperature and 110 days ≥30°C per year. That suggests lower ambient heat exposure, but it does not prove a specific battery-life advantage for every EV. (Climate Memory)
What is the average EV battery degradation per year?
Geotab's latest analysis reports 2.3% average annual degradation across more than 22,700 EVs covering 21 makes and models. The figure is a dataset average rather than a universal rate for every EV. (Geotab)
Does fast charging degrade an EV battery?
Geotab's latest analysis found a strong association between higher-power DC fast charging and faster degradation. Vehicles in its high-frequency/high-power group averaged 3.0% annual degradation compared with 1.5% for the low-frequency group. (Geotab)
Does charging an EV to 100% damage the battery?
An occasional full charge should not be equated with the battery spending most of its time at a very high state of charge. Geotab found degradation accelerated when vehicles spent more than 80% of their total time at or near full or nearly empty charge levels. (Geotab)
What is EV battery State of Health?
Battery State of Health, or SOH, describes the battery's current usable capacity relative to its capacity when new. Geotab uses SOH as its battery-condition measure and tracks capacity changes over time. (Geotab)
How do I check EV battery health?
A vehicle-specific battery diagnostic or telematics-based SOH measurement is more direct than estimating battery health from climate and mileage alone. Geotab describes measuring current battery capacity through energy input, energy output and changes in battery SOC over time. (Geotab)
Does battery chemistry affect degradation?
Yes. Geotab identifies battery chemistry as one factor that can contribute to differences in degradation between vehicle models. (Geotab)
Does battery thermal management matter?
Battery thermal-management design can influence degradation. Geotab identifies thermal management as one possible contributor to differences in degradation between vehicle models. (Geotab)
How long does an EV battery last?
There is no single lifespan applicable to every EV. Geotab's latest analysis reports an average degradation rate of 2.3% per year and states that modern EV batteries remain robust over long service lives, while also emphasizing variation by model and operating conditions. (Geotab)
Can climate alone predict EV battery degradation?
No. Climate is one factor, but Geotab's latest analysis also identifies charging power, state of charge, vehicle usage and vehicle-specific characteristics as relevant factors. (Geotab)
Is there a Chennai-specific EV battery degradation percentage?
Not one that can responsibly be presented as a universal rate for passenger EVs. A Chennai study examined specific 1.25 kWh, non-forced-cooled battery packs used in e-rickshaws, but those results should not be generalized to all passenger EVs. (ScienceDirect)
Is an EV battery degradation calculator a diagnostic?
No. A calculator produces an estimate based on its inputs and assumptions. Actual battery health requires vehicle-specific battery measurements or diagnostics. Geotab's own SOH methodology relies on vehicle data to estimate current battery capacity over time. (Geotab)
Key Takeaways
- EV battery degradation is real, but the rate varies by vehicle and operating conditions. (Geotab)
- Geotab's latest analysis of 22,700+ EVs across 21 makes/models found 2.3% average annual degradation. (Geotab)
- Vehicles operating in Geotab's hot-climate group degraded approximately 0.4 percentage points faster per year than those in mild climates. (Geotab)
- High-frequency, high-power DC fast charging was associated with 3.0% annual degradation, compared with 1.5% for the low-frequency group in Geotab's analysis. (Geotab)
- Chennai's cited climate normals show a 27.9°C mean daily temperature and 222 days ≥30°C/year. (Climate Memory)
- Delhi's cited climate normals show a 24.7°C mean daily temperature and 218 days ≥30°C/year. (Climate Memory)
- Bengaluru's cited climate normals show a 23.5°C mean daily temperature and 110 days ≥30°C/year. (Climate Memory)
- Climate data should not be converted directly into city-specific battery-degradation percentages.
- Battery chemistry, thermal management, charging power, SOC and usage can materially affect battery ageing. (Geotab)
- A city-based calculator should produce an estimate, not claim to provide a battery diagnostic.
Conclusion
So, how much does an EV battery degrade in Chennai vs Delhi vs Bengaluru?
The most scientifically defensible answer is: we do not have enough controlled, city-specific real-world evidence to assign one precise annual degradation percentage to each city.
What we do have is stronger evidence.
Geotab's latest analysis of more than 22,700 EVs across 21 makes and models found 2.3% average annual degradation. The same analysis found approximately a 0.4 percentage-point annual degradation difference between its hot and mild climate groups. It also found a substantially larger difference associated with high-power DC fast charging, with the high-frequency/high-power group averaging 3.0% annual degradation versus 1.5% for the low-frequency group. (Geotab)
The Indian city comparison adds useful climate context. Chennai has the highest mean annual temperature of the three cities in the cited ERA5-derived dataset, Delhi has high heat exposure combined with much greater seasonal variation, and Bengaluru has the lowest mean annual temperature and substantially fewer ≥30°C days. (Climate Memory)
But climate is only part of the equation.
The better way to estimate EV battery degradation is to combine city climate with the EV model, battery characteristics, thermal management, charging behaviour, state of charge and annual usage.
That is exactly where a transparent battery-degradation calculator becomes more useful than a simple “Chennai vs Delhi vs Bengaluru” percentage table.
Check your estimated EV battery health
Enter your city, EV model, vehicle age, mileage and charging habits to estimate battery health and potential capacity loss.
Important: The result should be treated as an estimated battery health figure, not a diagnostic measurement.
Authority references
- Geotab — 2026 EV Battery Health Study
- Geotab — 2026 Fast Charging & Degradation Study
- Geotab — 2024 Battery Degradation Study
- Climate Memory — Chennai ERA5 Climate Normals
- Climate Memory — Delhi ERA5 Climate Normals
- Climate Memory — Bengaluru ERA5 Climate Normals
- ScienceDirect — Chennai Li-ion Battery Pack Degradation Study
Important correction to the original brief: the current Geotab source describes the latest dataset as an analysis of 22,700+ EVs, and the detailed article identifies it as a 2025 analysis published/updated in 2026; I have therefore avoided calling it simply a “2026 dataset.” (Geotab)